The Ultimate Guide to Infographics


Did you know that people retain 65% of the information they see, but only 10% of the information they hear?
Also, people follow directions 323% better with a combination of text and illustration than instructions without illustrations.
That’s why, as a marketer, it’s important to display information in a combination of visual and text, in an easy-to-consume way.
A great way to do that is through infographics.
If you’ve wanted to create and publish an infographic, you’ve come to the right place. I know you might be thinking, “I’m not a graphic designer” or “I’ve never made an infographic before.” But you’re not alone.
And that doesn’t mean it can’t be easy for you to learn.
In this post, we’ll take you through everything you need to know about infographics, from what they are to what kinds of infographics there are to how to promote an infographic once you’ve created it.
Table of Contents
- What is an infographic?
- Infographic Examples
- Infographic Dimensions
- Infographic Ideas and Topics
- Infographic Tips
- Infographic Templates
- How to Share an Infographic
Infographics typically use engaging visuals to quickly and clearly communicate what the graphic is about.
People use infographics because they can provide a quick overview of a topic, explain a complex process, and display data easily. Infographics are also great for comparing two opposing concepts or ideas.
As a marketer, you might’ve experienced the feeling of indecisiveness when you want to create a marketing asset for a campaign, but you’re not sure the best way to disseminate the information. Is your idea best suited to a blog post, YouTube video, or social media post? The great news is that for any medium, in any industry, you can use infographics in your marketing.
Infographic Examples
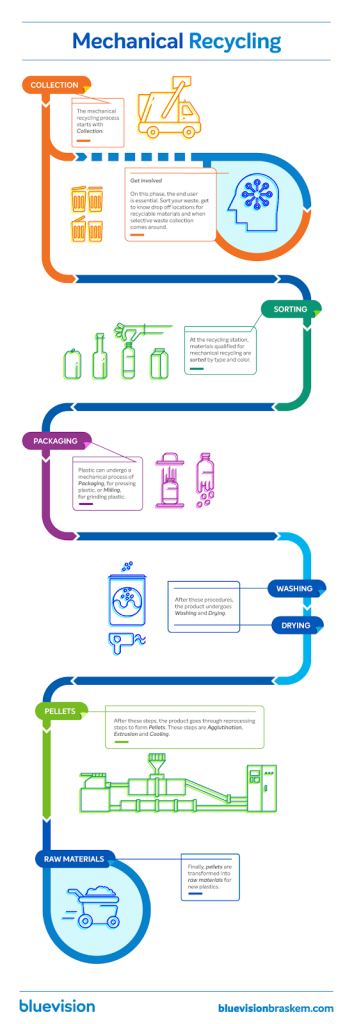
1. What is Guerilla Marketing, by Invite Referrals
Below is a great example of an infographic by Invite Referrals, which focuses on describing guerilla marketing. Instead of making a blog post or video, the company decided to explain, in detail, the concept of guerilla marketing in an infographic.
With an infographic, the information is easier to digest because it uses succinct copy and visuals to help get the point across.
Additionally, this infographic has a clear headline that communicates what it’s about, so readers can instantly tell what they’re going to get from reading it.
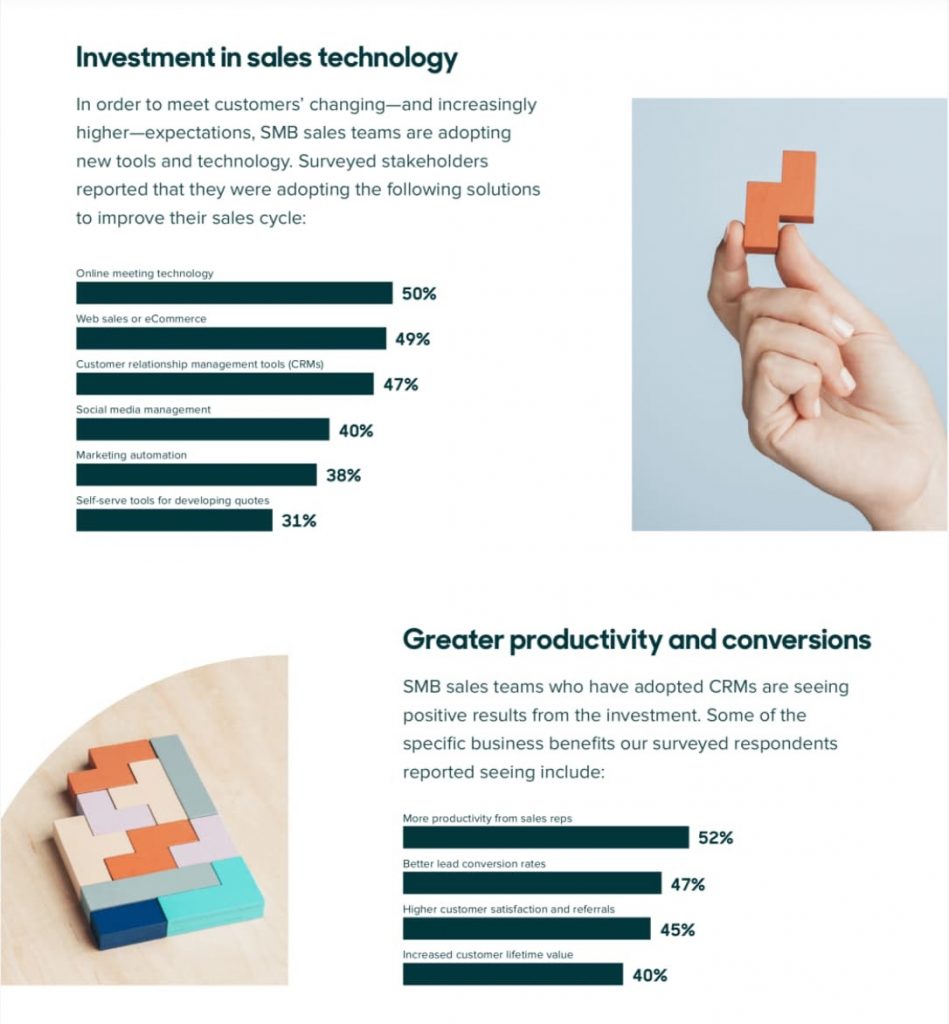
2. Small Business and Marketing, by SEO.com
This is another excellent example of an infographic because it uses a combination of data and visuals to give information on small business marketing.
The creator, SEO.com, also broke down the information into sections, so readers can easily scan the graphic and see what information they want quickly.
One of the ways this graphic excels is that it knows its buyer persona. SEO.com, a site to help marketers, made this infographic that directly targets small business owners and marketers.
<img src="https://lh6.googleusercontent.com/8Nl0EXIWMUgdIuXO7IuYC5mVNnxWfAy34YkB9_PLXr-WnAm3Daf0e78dXzK072kNgfmOZVPPxO5WjbShSq6tQBF1omjc6uPlEGZQSbfUUvhAsZKsqDzd-c1eYGfPagh7NilI_FWZ" width="488" height="2048" …read more
Source:: HubSpot Blog