
How to Create a Heat Map in Excel



Heat maps in Excel help businesses to visualize large data sets, transforming a pool of numbers into easily interpretable graphs. For example, a retailer can use a heat map to analyze sales data and find products that sell more during specific seasons.
In short, heat maps help you find and color-code correlations that may have been difficult to discern from raw data.
This guide will show you how to create heat maps in Excel of different types:
- A simple heat map with conditional formatting.
- A heat map with a custom color scale.
- A geographic heat map.
Let’s get started.
What is a heat map in Excel?
A heat map in Excel is a color-coded snapshot of your data, which helps you analyze thousands of data points and spot negative and positive trends and correlations at a glance.
Lighter colors represent lower values. Darker shades stand for higher ones. Though, you can invert them.
For example, you can depict higher conversion rates in green and lower in red.
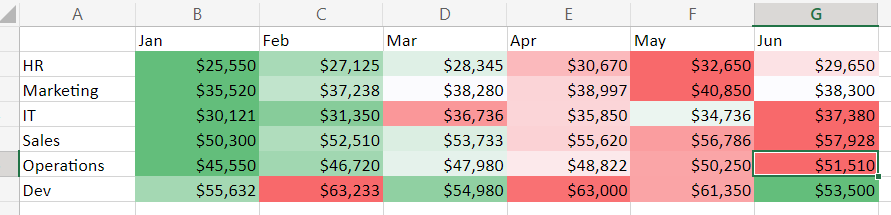
What falls in between will be colored in orange and a gradient with different shades of the three colors based on the value. Or you can fill cells in gradient shades, as shown in the example below.
The Benefits of Using Heat Maps.
Let’s go over four core benefits of Excel heat maps tailored to business needs.
1. Quick Data Interpretation
One of the primary benefits of using heat maps is the speed of data interpretation.
Consider a financial analyst assessing a company’s monthly expenses across different departments. Instead of working their way through a sea of numbers, analysts could use a heat map to quickly identify the departments with the highest and the lowest spending alike.
This allows for rapid insights and informed financial planning.
2. Discerning Trends and Patterns
Heat maps unveil hidden trends and patterns in your data that might be missed in raw, numerical form. For instance, a pet store could apply a heat map to analyze sales data over time (or for specific goods).
This way, you can spot a trend of higher sales during certain months or days, indicating peak shopping periods and helping in inventory and marketing planning.
3. Enhancing Presentations and Reports
Turn dull spreadsheets into engaging and representative visuals, making your reports easily read.
Suppose a marketing manager is presenting campaign performance to stakeholders. A heat map can quickly communicate which campaigns were successful and which fell short and why, ensuring clear and effective communication.

4. Simplifying Decision-Making
Are you a logistics manager at a manufacturing firm who must understand delivery times across different regions? Use Excel heatmaps.
Color regions with longer delivery times in darker shades to point out logistical inefficiencies.
<img alt="Create color-coded map charts in Excel (heatmaps)" src="https://blog.hubspot.com/hubfs/Google%20Drive%20Integration/heat%20map%20excel_52023-Jul-27-2023-12-57-59-6367-AM.png" style="margin-left: auto;margin-right: auto;display: …read more
Source:: HubSpot Blog





