How to Create a Pie Chart in Excel in 60 Seconds or Less

At the beginning of 2021, I was tasked with an assignment: Create a pie chart showcasing which types of content performed best on the Marketing Blog in 2020.
The question was an undeniably important one, as it would influence what types of content we wrote in 2021, along with identifying new opportunities for growth.
But once I’d compiled all relevant data, I was stuck — How could I easily create a pie chart to showcase my results?
Fortunately, I’ve since figured it out. Here, let’s dive into how you can create your own excel pie chart for impressive marketing reports and presentations. Plus, how to rotate a pie chart in excel, explode a pie chart, and even how to create a 3-dimensional version.
Let’s dive in.
How to Make a Pie Chart in Excel
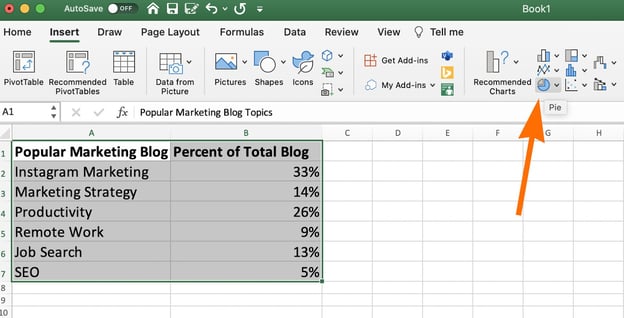
1. Create your columns and/or rows of data. Feel free to label each column of data — excel will use those labels as titles for your pie chart. Then, highlight the data you want to display in pie chart form.
2. Now, click “Insert” and then click on the “Pie” logo at the top of excel.

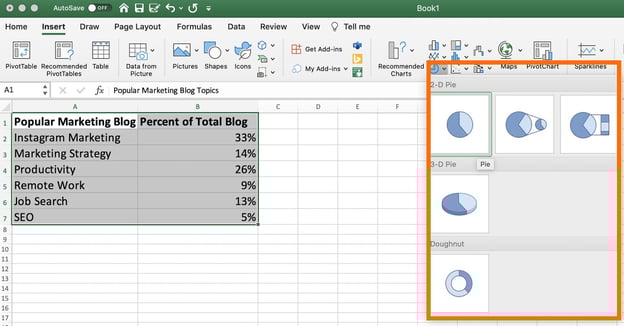
3. You’ll see a few pie options here, including 2-dimensional and 3-dimensional. For our purposes, let’s click on the first image of a 2-dimensional pie chart.

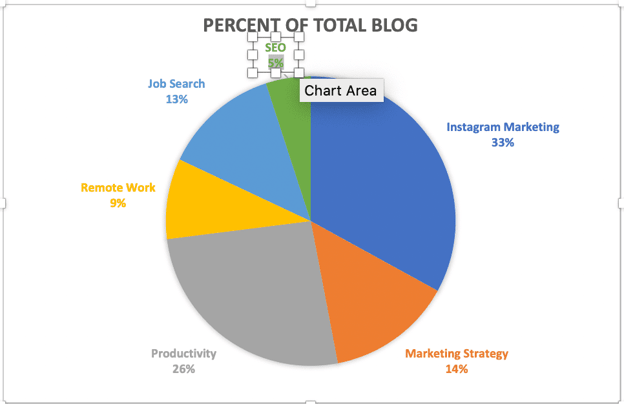
4. And there you have it! A pie chart will appear with the data and labels you’ve highlighted.

If you’re not happy with the pie chart colors or design, however, you also have plenty of editing options.
Let’s dive into those, next.
How to Edit a Pie Chart in Excel
Background Color
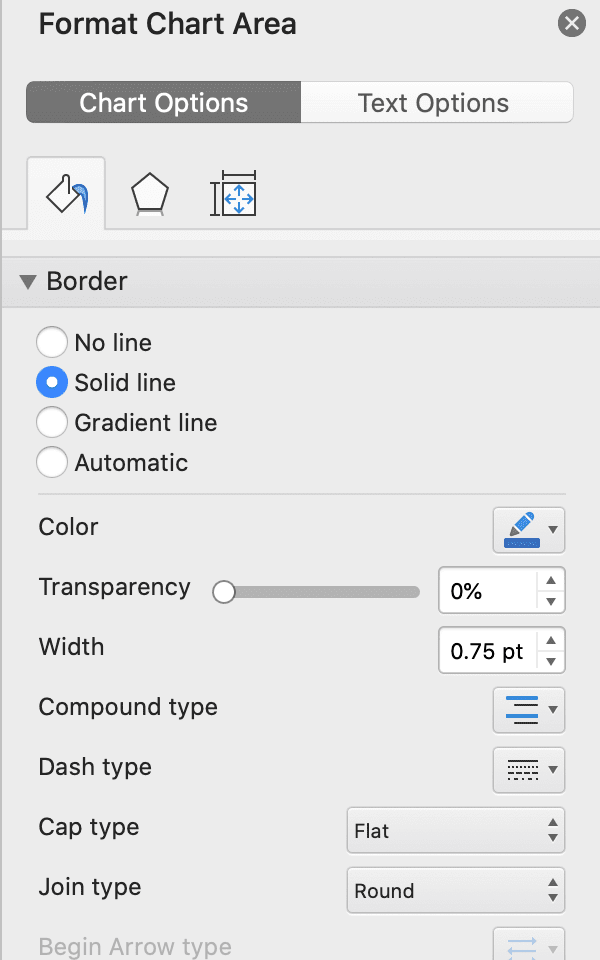
1. You can change the background color by clicking on the paint bucket icon under the “Format Chart Area” sidebar.
Then, choose the fill type (whether you want a solid color as your pie chart background, or whether you want the fill to be gradient or patterned), and the background color.

Pie Chart Text
2. Next, click on the text within the pie chart itself if you want to rewrite anything, expand the text, or move the text to a new area of your pie chart.

Pie Chart Border
3. Within the Format Chart Area, you can edit the border of your pie chart as well — including the border transparency, width, and color.

Pie Chart Shadows
4. To change the …read more
Source:: HubSpot Blog

![Download 9 Excel Templates for Marketers [Free Kit]](https://no-cache.hubspot.com/cta/default/53/9ff7a4fe-5293-496c-acca-566bc6e73f42.png)


