A Guide to Google Data Studio for Better Reporting

By Neil Patel
Data is the backbone of marketing. It can show you where to focus your ad spend, what types of customers are most profitable, and so much more.
On its own, however, data is just numbers. To make the most of your data, you need to understand what it means.
That is where Google Data Studio comes in. Unlike Google Analytics, which gathers the data and offers (limited) display analytics features, Google’s Data Studio goes all out to help you understand what your data means.
Not sure how it works or if it’s worth the effort? This guide explains what Google Data Studio does and shows you how to make the most of it.
What Is Google Data Studio?
Google Data Studio is an online data visualization tool that helps users convert data into informative reports and interactive dashboards.
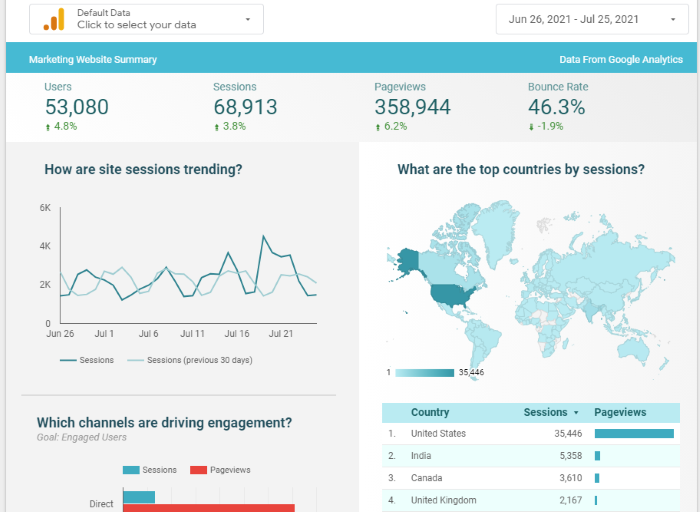
It is a powerful tool to help marketers and business owners use their data effectively by creating interesting reports like this one:

Google Data Studio is essentially a streamlined version of data visualization tools like Tableau and Clickview. While you won’t have access to quite as many features or coding capabilities, the platform is free and pretty easy to use.
Unlike platforms like Google Analytics or HubSpot, Data Studio is not a data source. It doesn’t collect the data; rather, it combines data from different sources, analyzes it, and then lets you create interactive reports, charts, and dashboards.
Why should you consider adding Google Data Studio to your marketing arsenal? Here are a few benefits:
- It’s free. (It is hard to beat that.)
- It combines data from several sources, providing a more accurate overview of your data.
- You can easily design charts, reports, and dashboards to help others understand what your data means.
- Dashboards allow you to sort and explore different data sets. For example, what is happening in a specific geographical region or during a particular month?
If you’re hitting a wall with your data and need a way to better understand how sales, marketing, or online traffic impacts your business, Google Data Studio is a tool you should use.
How to Use Google Data Studio to Improve Your Data
The first step to using Google Data Studio is to log in, which you can do here. You will need a Google account to access the platform. Below, we’ll walk through how to create a report, add data, and generate your first report.
1. Choose a Google Data Studio Report Template
There are two ways to create a report: create a blank report or use one of the templates. I recommend starting with a template, which you can customize to fit your needs. Once you have a better grasp of the platform, you can try your hand at a blank report.
Click Template Gallery to see more. Dozens of templates are available to choose from:
Source:: Kiss Metrics Blog


