A Beginner’s Guide to Google Analytics

By Neil Patel
Are you making the most out of the data you can get about your website from Google Analytics (GA)?
The free tool gives you valuable insights into metrics like conversion rates, traffic sources, engagement, audience demographics, and more.
Let’s learn what GA is and how to use it to improve your website’s metrics.
What Is Google Analytics?
Google Analytics is a free tool to track user behavior on your website. With a range of metrics to explore, you can start to get a picture of how people use your website and how you can make changes to increase sales.
On a basic level, you can track how many visitors you have, how they found you, the number of views a page receives, and more.
In many ways, Google Analytics is the portal giving you insider, back end, and real-time access to what your users want.
Why Should You Use Google Analytics?
Google Analytics is the most powerful tool to track website metrics, and it comes from the king of search engines. On top of that, it’s free.
Although it takes some work to get set up, there are plenty of online tutorials and resources to walk you through the process. Once you get Google Analytics connected to your site, you can head to the Google Analytics dashboard and start checking things out. It can’t go back in time, though, so you will have to wait for data to gather.
Google Analytics can free you from relying on gut checks and intuition and instead tell you what pages and which content hit the mark or fall short. In this way, you can make informed choices.
The Basic Google Analytics Interface
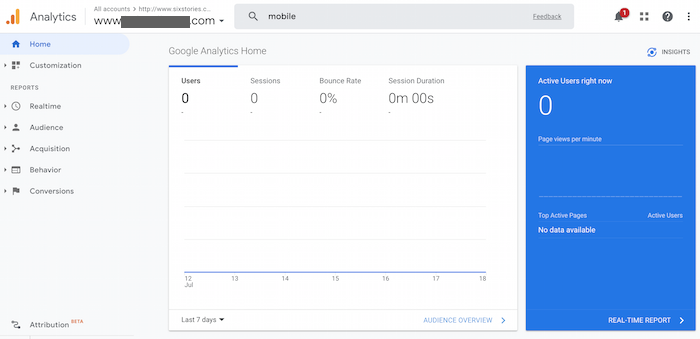
Once you set up your Google Analytics account, you can connect different URLs and choose which one to explore from the drop-down.
The first thing Analytics shows is basic traffic data, including dates. You can alter the dates based on your needs.
On the left side of the screen, Google Analytics provides a list of report options. This is where you can start to get into the details.

On the far right, there’s a blue box with real-time metrics showing how many people are on the site, how many pages are viewed per minute, and the most popular pages to view. You can then click on the blue box to learn more about the data.
If you’re looking for something specific, just type it into the handy search bar.

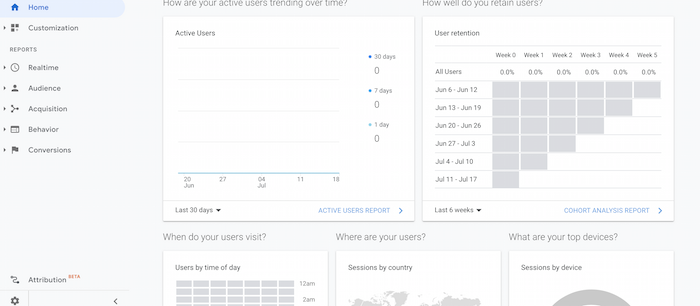
As you scroll down, you can check out different analytics, including where your users come from and what devices they use.
Common Metrics Tracked With Google Analytics
There are many metrics you can track using Google Analytics.
No matter which type you focus on, you need to choose a time frame for your data. This way, you …read more
Source:: Kiss Metrics Blog


