
SEO Forecasting in Google Sheets

By Tom.Capper
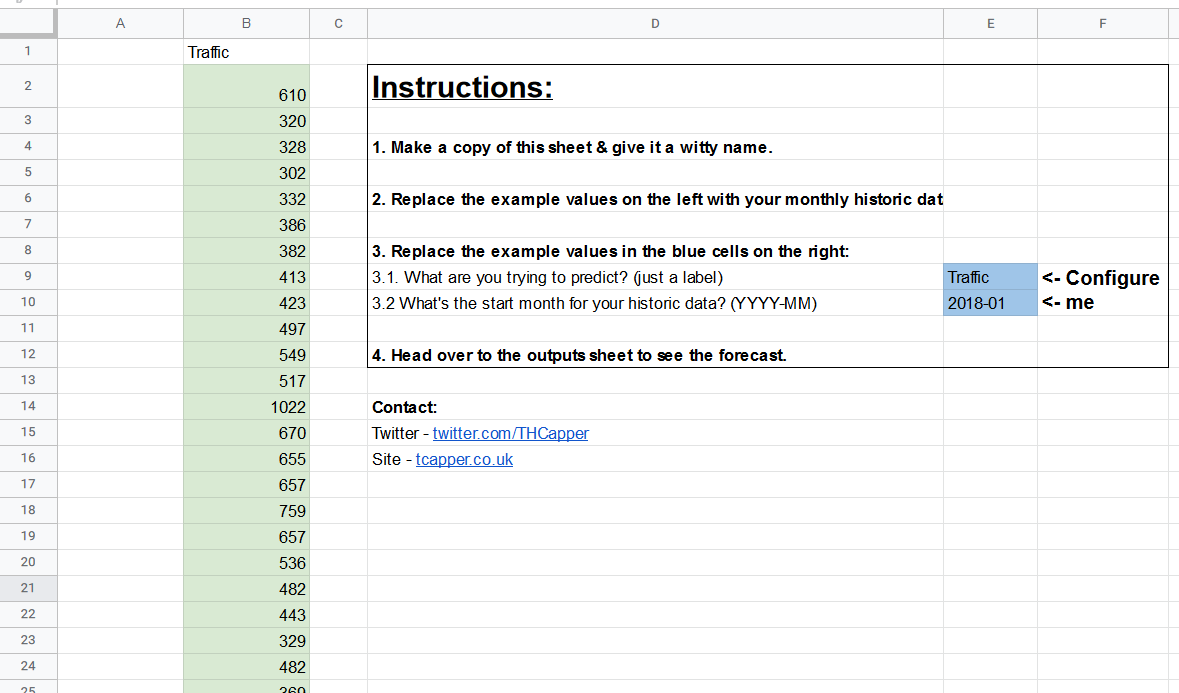
You should only be changing values in the colored cells.
The blue cells in column E are basically to make sure everything ends up correctly labelled in the output. So, for example, if you’re pasting session data, or click data, or revenue data, you can set that label. Similarly, if you enter a start month of 2018-01 and 36 months of historic data, the forecast output will begin in January 2021.
On that note, it needs to be monthly data — that’s one of the tradeoffs for simplicity I mentioned earlier. You can paste up to a decade of historic monthly data into column B, starting at cell B2, but there are a couple of things you need to be careful of:
- You need at least 24 months of data for the model to have a good idea of seasonality. (If there’s only one January in your historic data, and it was a traffic spike, how am I supposed to know if it was a one-off thing, or an annual thing?)
- You need complete months. So if it’s March 25, 2021 when you’re reading this, the last month of data you should include is February 2021.
Make sure you also delete any leftovers of my example data in column B.
Outputs
Once you’ve done that, you can head over to the “Outputs” tab, where you’ll see something like this:
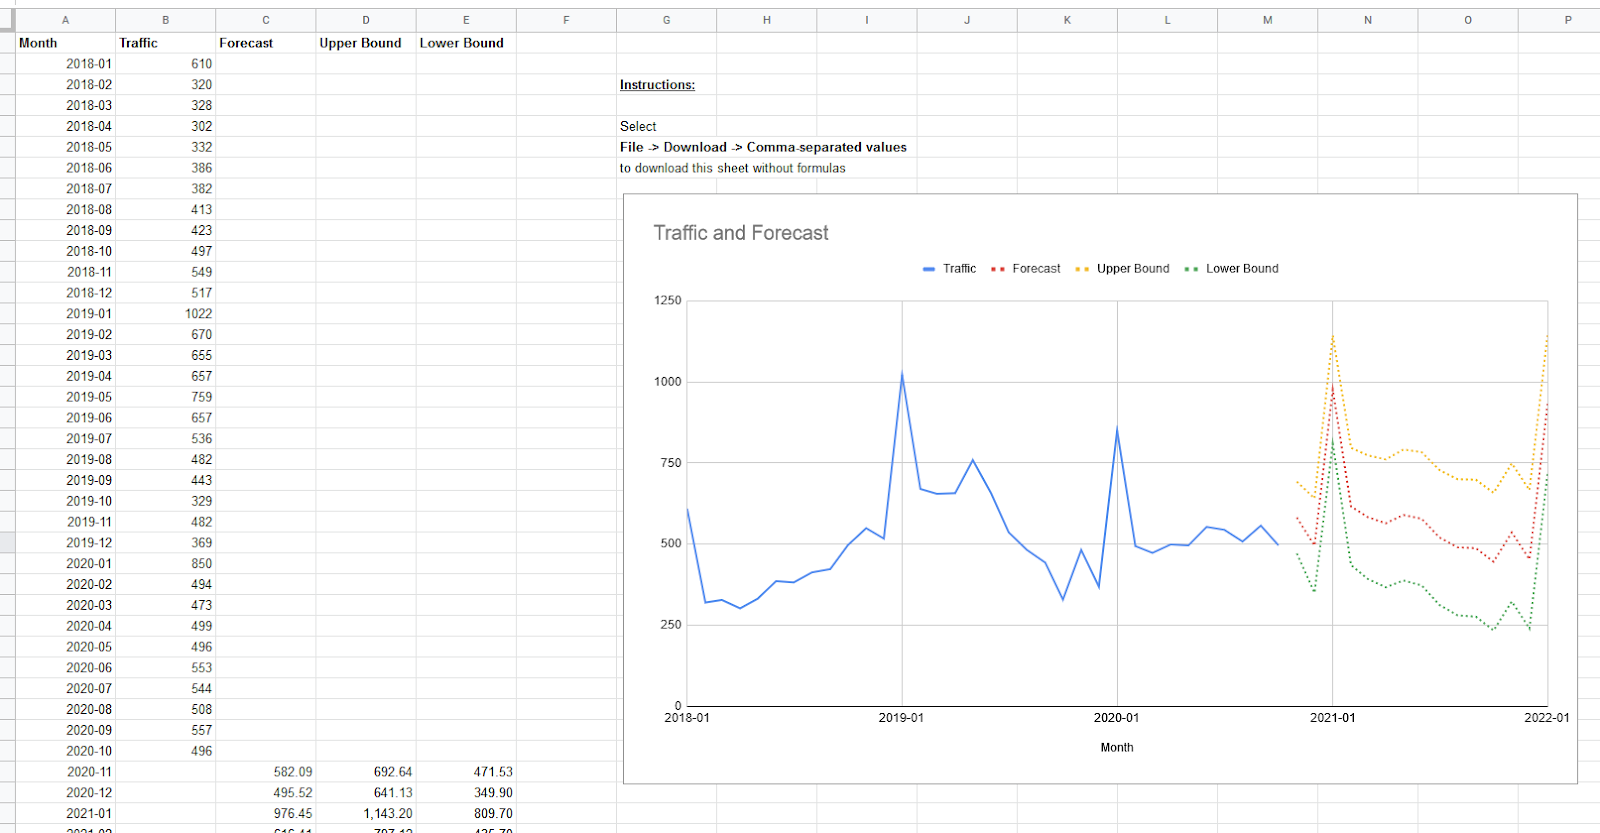
Column C is probably the one you’re interested in. Keep in mind that it’s full of formulas here, but you can copy and
Posted by Tom.Capper
Way back in 2015, I published an article giving away a free, simple, forecasting tool, and talking through use cases for forecasting in SEO. It was a quick, effective way to see if a change to your site traffic is some kind of seasonality you can ignore, something to celebrate, or a worrying sign of traffic loss.
In short: you could enter in a series of data, and it would plot it out on a graph like the image above.
Five years later, I still get people — from former colleagues to complete strangers — asking me about this tool, and more often than not, I’m asked for a version that works directly in spreadsheets.
I find this easy to sympathize with: a spreadsheet is more flexible, easier to debug, easier to expand upon, easier to maintain, and a format that people are very familiar with.
The tradeoff when optimizing for those things is, although I’ve improved on that tool from a few years ago, I’ve still had to keep things manageable in the famously fickle programming environment that is Excel/Google Sheets. That means the template shared in this post uses a simpler, slightly less performant model than some tools with external code execution (e.g. Forecast Forge).
In this post, I’m going to give away a free template, show you how it works and how to use it, and then show you how to build your own (better?) version. (If you need a refresher on when to use forecasting in general, and concepts like confidence intervals, refer to the original article linked above.).
Types of SEO forecast
There is one thing I want to expand on before we get into the spreadsheet stuff: the different types of SEO forecast.
Broadly, I think you can put SEO forecasts into three groups:
- “I’m feeling optimistic — add 20% to this year” or similar flat changes to existing figures. More complex versions might only add 20% to certain groups of pages or keywords. I think a lot of agencies use this kind of forecast in pitches, and it comes down to drawing on experience.
- Keyword/CTR models, when you estimate a ranking change (or sweeping set of ranking changes), then extrapolate the resulting change in traffic from search volume and CTR data (you can see a similar methodology here). Again, more complex versions might have some basis for the ranking change (e.g. “What if we swapped places with competitor A in every keyword of group X where they currently outrank us?”).
- Statistical forecast based on historical data, when you extrapolate from previous trends and seasonality to see what would happen if everything remained constant (same level of marketing activity by you and competitors, etc.).
Type two has its merits, but if you compare the likes of Ahrefs/SEMRush/Sistrix data to your own analytics, you’ll see how hard this is to generalize. As an aside, I don’t think type one is as ridiculous as it looks, but it’s not something I’ll be exploring any further in …read more
Source:: Moz Blog






